How Variability Can Masquerade as Uncertainty: Representation Errors in Satellite Salinity
By Kyla Drushka
The launch of the SMOS (2009), Aquarius (2011) and SMAP (2015) satellites heralded a new era of oceanographic observation: salinity measurements from space. Previously, salinity was only measured in situ, most broadly through the global network of Argo floats that began sampling in the early 2000s. Although the Argo program radically increased the observation of ocean salinity, Argo floats nominally make one measurement per 3 degrees longitude x 3 degrees latitude every 10 days, with few Argo floats in polar and coastal oceans and in marginal seas. Salinity satellites are thus a valuable complement to the Argo network, providing weekly global maps with ~1 degree horizontal resolution, and have provided unprecedented measurements of global surface salinity variability, enabling a better understanding of ocean variability and climate phenomena. The satellite salinity community has undertaken a significant effort to validate measurements from these new sensors, and continues to do so in order to refine algorithms and improve the accuracy and resolution of salinity products. Much of the validation is done by comparing salinity measurements from satellites and those from Argo floats. While this approach seems fairly straightforward, two major factors complicate the satellite-in situ comparisons: vertical and horizontal gradients in salinity. These both lead to representation errors, which are differences in what satellite and in situ measurements represent rather than errors in what the sensors measure. Representation errors are important to distinguish from measurement errors when assessing the uncertainty of the satellite measurements. In this post, I want to introduce the concept of representation errors, describe how they are distinct from other types of errors, and suggest some strategies for handling them.
L-band (~1.4 GHz frequency) radiometers measure salinity by exploiting the fact that the emissivity of seawater at that frequency is related to its salinity (as well as its temperature). The L-band passive radiometers used to measure salinity from space sample the ocean at around 1 cm depth, whereas the shallowest Argo measurements are typically at 1 to 5 m depth. In a well-mixed ocean, it’s safe to assume that the salinity at these two depths is the same so the measurements can be compared directly. However, rain falling on the ocean can produce near-surface fresh layers (also called puddles or lenses) that can have substantially lower salinity than the water just beneath*:
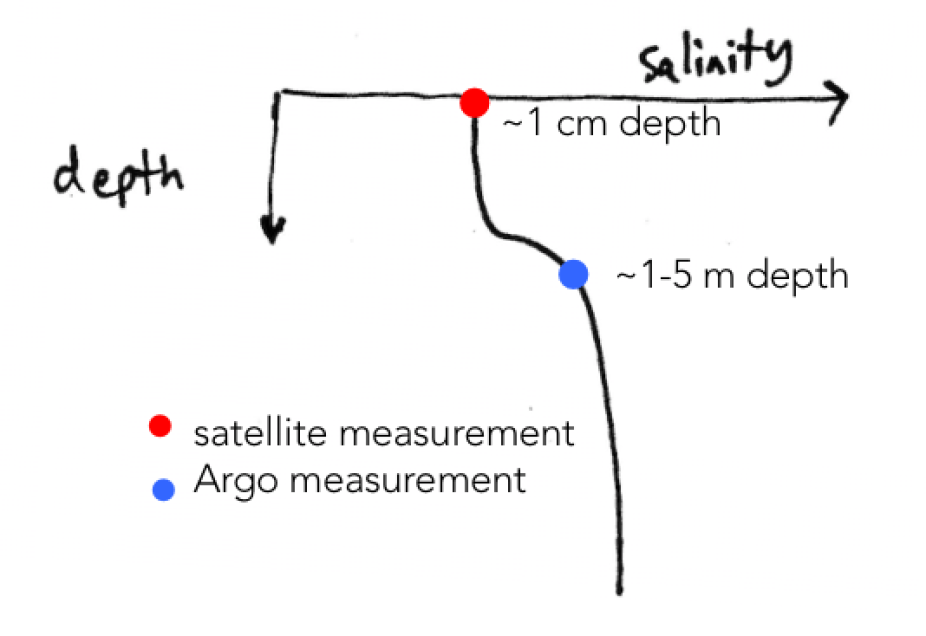
Vertical profile of salinity within a rain-formed fresh layer: the satellite salinity measurement, made at ~1 cm depth, is fresher than an Argo measurement made at ~1-5 m depth. (Adapted from Boutin et al., 2015.)
This means that satellite salinity measurements in rainy regions can be systematically fresher than the 5-m salinity measured by Argo floats. This is particularly the case in regions with low wind speeds (e.g., the intertropical convergence zone), where upper ocean mixing is low and rain-formed fresh layers can persist for tens of hours. This makes the satellite salinity measurements appear to have a fresh bias, when in fact they just represent a different depth. In other words, these apparent errors in the satellite data are not actually errors at all. Understanding where and when surface fresh layers are present has thus become an important part of understanding how much of the satellite-in situ salinity differences are due to measurement errors versus sampling differences.
The horizontal variability of salinity adds another complication. The signal measured by a satellite radiometer is effectively a weighted spatial average over a footprint that is ~40 to 100 km across (depending on the satellite), and is compared to a point measurement from an Argo float that has popped up at random somewhere within that footprint. In regions with a lot of horizontal salinity variability, it is probable that an Argo float will sample at a location that does not represent the average salinity over the footprint. This is demonstrated by the following image, which shows a map of surface salinity in the California Current taken from a high-resolution model, with an example satellite footprint and two example Argo floats superimposed:
In this case, there is a strong mesoscale front through the middle of the satellite footprint, so an Argo float sampling at a random location within the footprint would appear to be measuring a different value than the satellite. River plumes, melting ice, ocean currents and instabilities, and rainfall can all generate surface salinity variability on horizontal scales smaller than one satellite radiometer footprint. As in the case of vertical salinity gradients, this can lead to differences between the satellite and in situ salinities that might be interpreted as uncertainty – but is in fact a mismatch in the scales of the two measurements being compared. While here we have focused on the case of salinity, these types of representation errors are an issue for comparing any remotely sensed and in situ measurements, for instance sea surface temperature, winds over the ocean, surface currents, wave heights, etc.
So, what are some strategies for handling representation errors in satellite validation efforts?
- Use models or observations to estimate the contribution of sampling differences to satellite/in-situ comparisons. For instance, d’Addezzio et al. (2019) used high-resolution model output to estimate the surface salinity variability on scales smaller than the satellite footprint; Drushka et al. (2019) used in situ salinity observations from ships to assess how much this sub-footprint-scale variability contributes to uncertainties in satellite measurements. Santos-Garcia et al. (2014) developed a “rain impact model” to predict the vertical salinity gradients due to rain; these estimates are now provided as part of the Aquarius satellite salinity product.
- Develop protocols for matching up satellite & in situ measurements, so that the match-up statistics can be done consistently across datasets and platforms. The Salinity PiMEP effort aims to do this for salinity by compiling data from numerous in situ and satellite salinity products and allowing users to compute statistics through an interactive website.
- Provide uncertainty estimates on satellites products (e.g., due to uncertainties in corrections for sea surface temperature and roughness; atmospheric, ionospheric, and galactic signals; and satellite navigation, among others). Meissner et al., (2018) separate these into systematic (fluctuate on time scales \>1 month and spatial scales \>100 km) and random (shorter time and length scales) components. Such uncertainty estimates are independent of Argo or other in situ data, and thus enable users to quantify how much of satellite-in situ differences are expected from instrument noise and measurement errors. The Aquarius salinity product comes with separated estimates of random and systematic uncertainty; SMOS and SMAP come with total uncertainty estimates.
- When presenting data from the upper few meters of the ocean, explicitly state the measurement (or model) depth rather than simply labeling them as surface data, which can be misleading when near-surface vertical gradients are present.
*In typical fresh lenses, salinity at 1 cm depth is on order 0.1 to 1 psu fresher than at 5 m depth… but during the SPURS-2 experiment, we observed a surface freshening of 10 psu during very heavy rain, low wind conditions!
References
Boutin J, Chao Y, Asher WE, Delcroix T, Drucker R, Drushka K, et al. Satellite and In Situ Salinity: Understanding Near-Surface Stratification and Subfootprint Variability. Bull Amer Meteor Soc. 2015 Dec 16;97(8):1391–407.
D’Addezio JM, Bingham FM, Jacobs GA. Sea surface salinity subfootprint variability estimates from regional high-resolution model simulations. Remote Sensing of Environment. 2019 Nov 1;233:111365.
Drushka K, Asher WE, Sprintall J, Gille ST, Hoang C. Global Patterns of Submesoscale Surface Salinity Variability. J Phys Oceanogr. 2019 Apr 25;49(7):1669–85.
Meissner T, Wentz FJ, Le Vine DM. The Salinity Retrieval Algorithms for the NASA Aquarius Version 5 and SMAP Version 3 Releases. Remote Sensing. 2018 Jul;10(7):1121.
Santos-Garcia A, Jacob MM, Linwood Jones W. Near-surface salinity stratification observed by SMOS under rainy conditions. In: Geoscience and Remote Sensing Symposium (IGARSS), 2015 IEEE International. 2015. p. 117–20.